MOBIL-O-GRAPH
Introduction
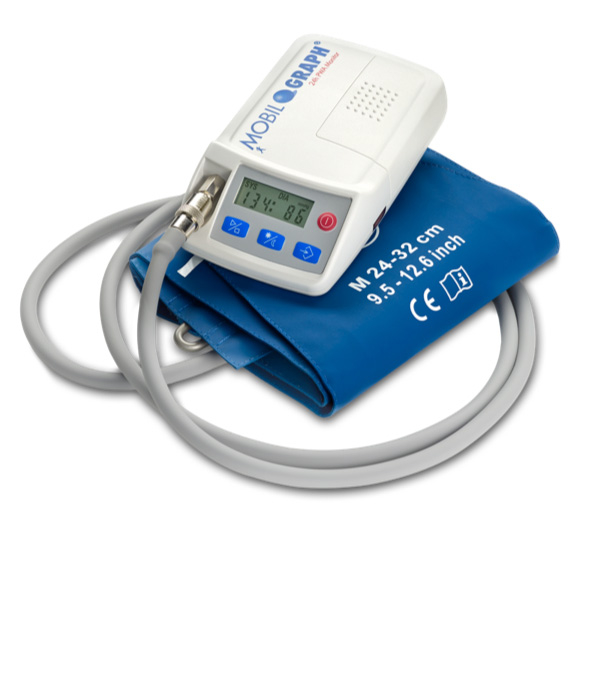 Mobil-O-Graph® is a validated monitor for the measurement of brachial blood pressure, central blood pressure and aortic pulse wave velocity. It is a versatile system, as it allows for single, sequential (eg. 10 readings over 30 minutes) and ambulatory (24/48h) recordings.
Mobil-O-Graph® operates via a standard upper-arm cuff for the measurement of blood pressure and the recording of brachial pulse waves.
Pulse waves are acquired by means of the oscillometric sensor over a time period of ten seconds at diastolic (cuff) blood pressure load. The acquisition phase of the pulse waves is immediately attached to the measurement of brachial blood pressure. In consequence, the entire measurement duration for blood pressure and pulse wave acquisition sums up to about 50 seconds (depending on blood pressure level and heart rate of the subject).
The use of bio-mathematical algorithms (generalized transfer function) allow for calculation of central blood pressure and aortic pulse wave velocity, based on the brachial wave form data.
Mobil-O-Graph® results has been successfully validated against invasive and non-invasive reference standards, incl. cardiac micro-pressure tip catheter, fluid-filled catheter, applanation tonometry, cardiac MRI, Doppler and auscultatory sphygmomanometry.
Mobil-O-Graph® sofware allows for the export of data into Excel and CSV file format, containing following parameters out of the pulse wave analysis: Systolic (brachial) BP, diastolic (brachial) BP, mean arterial pressure (MAP), pulse pressure (brachial), systolic (central) BP C1 (calibrated by brachial systolic and diastolic BP), systolic (central) BP C2 (calibrated by brachial mean and diastolic BP), diastolic (central) BP, heart rate, augmentation pressure, augmentation index, augmentation index (at) 75, stroke volume, cardiac output, reflection magnitude, total vascualar resistance, P1, P2, pressure amplitude of the inflection wave (Pf), presssure amplitude of the reflection wave (Pb), (aortic) pulse wave velocity.
Algorithm overview
Upon accomplishment of the pulse wave signal acquisition, a multiple-step process is initiated (ARCSolver® – name of the generalized transfer function integrated in Mobil-O-Graph®):
In a first step the recorded pulse waves are checked for their plausibility and qualified according to pre-defined quality criteria. In case the input signal has qualified as acceptable, the concepts of wave harmonics and Fourier analysis are applied for the calculation of an aortic pressure curve.
In parallel, an aortic flow curve is derived, by means of a modified Windkessel model. Consecutively, the pressure and flow curves are super-imposed in a virtual model.
In the virtual model, the physiological principle is considered, that the flow curve follows the pressure gradient. The observed time discrepancy between the flow and pressure curves is a direct result of characteristic impedance (wave resistance).
An increase in time delay between the two curves is associated with a decrease in arterial stiffness (low wave resistance). Vice versa, a reduced time delay equals an increase in arterial stiffness.
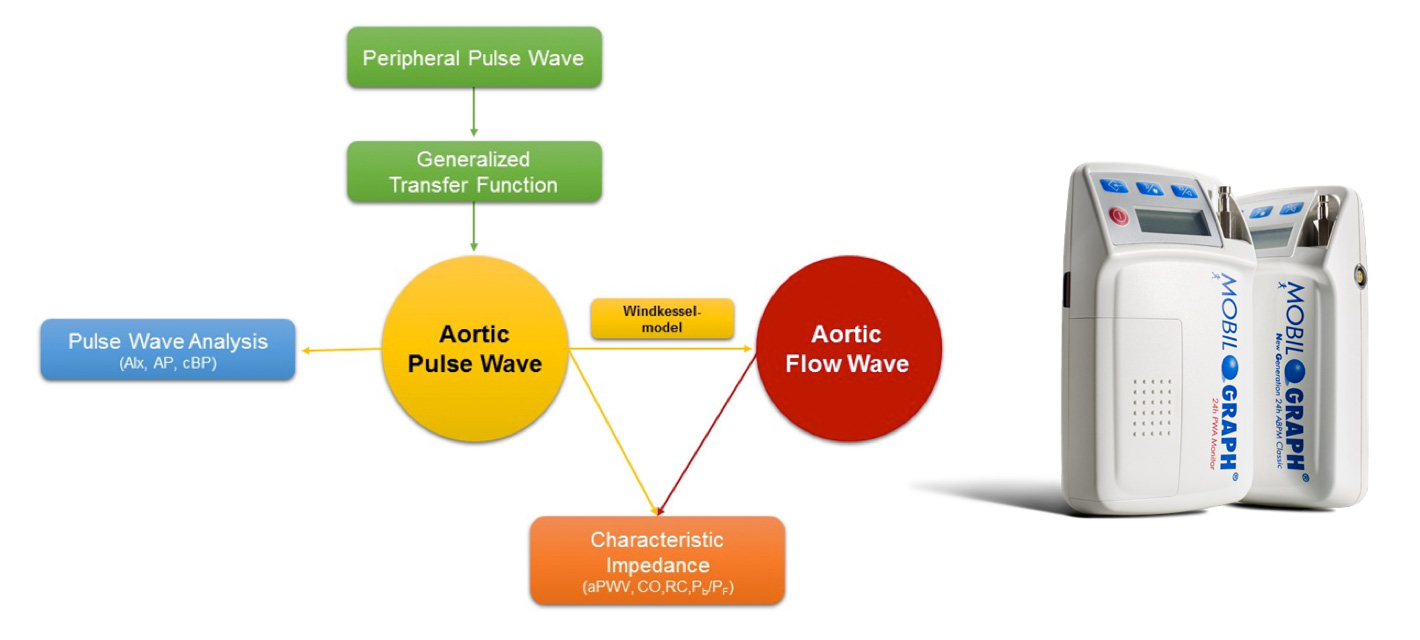
Figure: Flow diagram of multiple-step process for calculation of central blood pressure and aortic pulse wave velocity